Are Dental Practices Becoming Less Active?
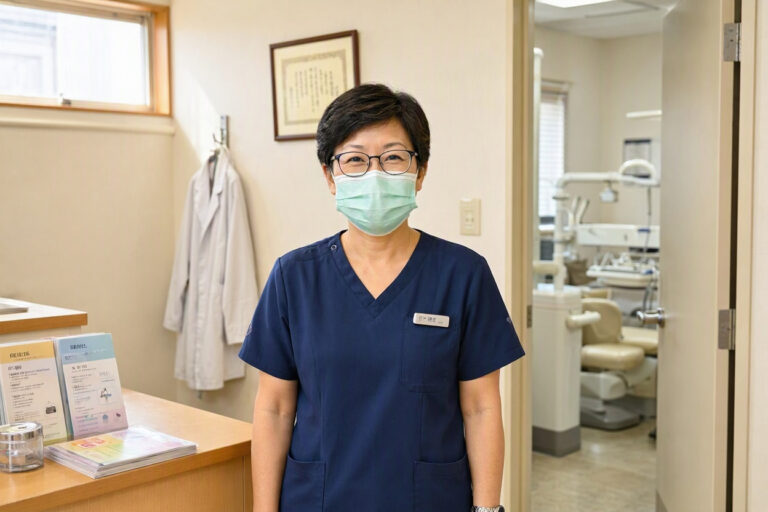
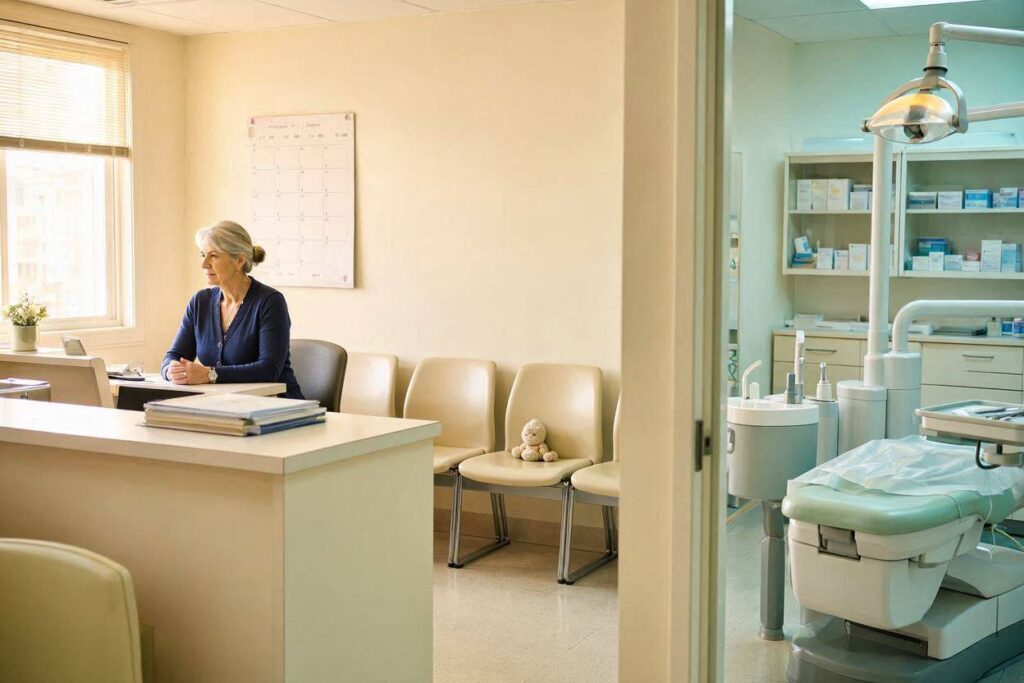
Walk into a dental office on a Tuesday morning in 2024, and you might notice something strange. The waiting room, once packed with patients flipping through outdated magazines, has empty chairs. The front desk staff, historically juggling three phone lines at once, seems unhurried. The dentist, who once sprinted from operatory to operatory seeing 40 patients a day, now lingers over a single crown preparation with an almost meditative calm. The immediate sensory input suggests an answer: yes, dental practices are slowing down.
But the data tells a much stranger, more layered story. Dental practices are not uniformly “becoming less active.” They are bifurcating. A segment of the profession is drowning in demand, booked solid for months, and turning away new patients. Another segment is seeing daily production numbers that would have been a crisis in 2019, now accepted as the “new normal.” The question “Are dental practices becoming less active?” requires dissecting workforce demographics, private equity consolidation, the hygienist shortage, and a fundamental shift in how dentists calculate a “full” schedule. This article unpacks the collapse of the pre-pandemic production hamster wheel and asks whether the slowdown is a sign of decay or a deliberate, hard-won recalibration toward quality over quantity.
The Workforce Exodus: Retirements and the Hygienist Desert
The single largest driver of reduced practice activity is not a lack of patients—it is a lack of hands to treat them. During the COVID-19 pandemic, a massive wave of seasoned dental hygienists and older dentists took early retirement or simply walked away from the profession entirely. The American Dental Association’s Health Policy Institute documented a staggering loss: roughly 8% of hygienists left the workforce permanently in 2020-2021 alone. In some states, the shortage is so severe that practices have cut their hygiene hours by 30% simply because they cannot hire a warm body with a license, regardless of the wage offered.
This is not a demand-side problem. Patients are calling. They want cleanings. The practice is “less active” statistically because the hygiene column—the engine of the dental business—is running on three cylinders. A dentist who employed three full-time hygienists in 2019 and now employs one and a half is seeing half the preventive patients. Half the prophies. Half the periodontal maintenance visits. The downstream effect is catastrophic: fewer recare appointments mean fewer diagnosed crowns, fillings, and implant consultations. The practice’s total “activity” is throttled by the bottleneck at the front door of the hygiene schedule. This is a supply-side constriction, not a demand collapse.
The Production-Per-Patient Paradox: Doing Less, Earning More
A counterintuitive phenomenon has emerged. Some practices report lower patient volume—seeing fewer heads in chairs per day—but higher revenue per patient. The activity metric that crashed was “number of patient encounters.” The activity metric that soared was “average production per encounter.”
Dentists, facing burnout and the existential crisis of the pandemic, are practicing slower. They book longer appointment times. They no longer triple-book the crown seat, the emergency exam, and the denture adjustment into the same hour. Instead, they focus on comprehensive care: quadrant dentistry, full-arch rehabilitations, and high-ticket implant cases. If a dentist once saw 15 patients at $200 each ($3,000 daily production) and now sees 7 patients at $500 each ($3,500 daily production), the practice is objectively “less active” in terms of foot traffic and patient volume, but the business is healthier. The revenue-per-hour metric is the counter-narrative to the “decline” story.
This shift is partly a rejection of the assembly-line dentistry model that dominated corporate chains in the 2010s. Younger dentists, weighted with massive student loan debt, are rejecting the idea that they must drill, fill, and bill 40 patients a day to be successful. They are choosing a lower-volume, higher-fee, higher-skill path. The practice seems quieter because the dentist is spending 90 minutes on a ceramic overlay instead of 15 minutes on an amalgam. The “activity” has changed in character, not just magnitude.
Private Equity and the Corporate Slowdown
The dental service organization (DSO) model—private equity-backed chains like Heartland Dental, Aspen Dental, and Pacific Dental Services—has historically been obsessed with volume metrics. Daily production goals, new patient counts, and “same-day starts” on treatment plans were the gospel. The pandemic broke this model temporarily, and the recovery has exposed cracks.
DSOs are suffering from the same staffing shortages as private practices, but their corporate overhead makes the pain acute. A DSO office cannot easily offer a hygienist a $10,000 signing bonus and a four-day work week without corporate approval, while a private dentist-owner can make that decision in five minutes. DSO offices are struggling to fill operatories, and their activity levels have dropped noticeably in markets where they previously dominated. However, this does not mean the DSOs are retreating. They are pivoting to higher-production procedures—orthodontics, clear aligners, implants—that require fewer patient visits but generate massive per-case revenue. The corporate practice looks less active because the waiting room is not a revolving door of recall exams, but the profit-and-loss statement may still show growth. Activity is being redefined internally.
The Insurance Reimbursement Squeeze and Appointment Inflation
Dental insurance reimbursement rates have stagnated for decades while overhead has soared. In 1990, a crown might be reimbursed at $700. In 2024, that same crown is reimbursed at $800, while lab fees, staff wages, and rent have tripled. To compensate under the old model, dentists increased volume—they ran faster on the hamster wheel. The pandemic broke the wheel.
Now, some dentists are deliberately becoming “less active” in the PPO network sense. They are dropping insurance contracts entirely, transitioning to fee-for-service or in-house membership models. When a practice drops Delta Dental, it loses a wave of price-sensitive patients who were coming in for their “free cleaning.” The schedule shrinks overnight. The practice is visibly less active. But the remaining patients pay cash fees that are 50-100% higher than the insurance fee schedule. The practice may produce the same gross revenue with 60% of the patient volume. This is a strategic deactivation of low-margin activity. It is not a sign of a dying practice; it is a sign of a practice amputating a gangrenous limb to save the body.
The Fear Gap: Dental Avoidance Post-COVID
We must also confront the patient psychology angle. A non-trivial segment of the population, having skipped dental visits during 2020-2021 lockdowns, simply never returned. This is not the majority of patients, but a stubborn 10-15% who “fell through the cracks.” They have untreated decay, gum disease, and broken teeth, but their habit loop of six-month recare was broken, and the dental office now feels like a foreign, anxiety-inducing space they would prefer to avoid.
This group contributes to lower overall practice activity, but they represent a looming wave of future demand, not a permanent market contraction. When the neglected crown fractures at dinner, they will call. The “procrastination cohort” is suppressing current demand while simultaneously inflating the severity of future treatment plans. The practice sees a lull in 2023, followed by a flood of emergency full-mouth extractions and implant consultations in 2025-2026. The activity dip is a temporal shift, not a structural decline.
Comparative Table: The “Less Active” Practice vs. The “Optimizing” Practice
To disentangle the decline narrative from the adaptation narrative, we can compare the characteristics of a genuinely struggling practice with those of a deliberately right-sizing practice.
| Feature | Struggling/Declining Practice | Strategically Right-Sizing Practice |
|---|---|---|
| Hygiene Schedule | Large unfilled gaps; no waitlist. | Fully booked but fewer days; waitlist exists. |
| New Patient Flow | Declining monthly; few internal referrals. | Steady flow; aggressively screening for “ideal” cases. |
| Procedure Mix | Small, low-value fillings; single crowns. | Full-arch, implants, cosmetics, sleep apnea. |
| Insurance Participation | Dependent on PPO networks. | Dropping networks; fee-for-service migration. |
| Staffing | Understaffed, high turnover, morale low. | Lean team; well-compensated; low turnover. |
| Revenue | Down year-over-year; emergency fund depleting. | Flat or up slightly on lower patient volume. |
The table reveals the diagnostic trap. Both practices “look” less active than the frantic pace of 2018, but one is dying of malnutrition while the other is practicing intermittent fasting.
The Rise of the “Slow Dentistry” Movement
A cultural shift within the profession must be acknowledged. There is a growing, vocal contingent of dentists who actively reject high-volume, low-quality dentistry as a mental health necessity. The “Slow Dentistry” movement, borrowing language from the slow food and slow medicine philosophies, advocates for ethical, unhurried care. It emphasizes informed consent, meticulous isolation with a rubber dam, single-tooth anesthesia instead of quadrant blocks, and genuine conversation with the patient before the drill starts.
A “Slow Dentistry” practice is definitionally less active by the old metrics. It treats half the patients, and the daily production report may look anemic to a corporate-trained dentist. But the outcomes—fewer failing restorations, lower patient anxiety, fewer legal claims—are superior. This movement is small but growing, and it is pulling the profession’s average activity numbers downward. This is a long-term positive for patient care, even if it makes industry benchmarking reports look scary.
The Looming Demand Tsunami: The Aging Population
The demographic counterweight to the “less active” narrative is the silver tsunami. 10,000 Baby Boomers turn 65 every day, and they are retaining their natural teeth far longer than previous generations. They have heavily restored dentition—mouths full of 30-year-old crowns, bridges, and fillings that are failing simultaneously. They have disposable income and a cultural expectation of keeping their teeth for life.
This demographic will drive demand for complex restorative, implant, and periodontal care for the next two decades. The practices that feel “less active” today because they are shifting away from child prophies and single-surface composites will be flooded with implant consults and full-mouth rehab cases from this cohort. The current lull is a strategic repositioning, not a permanent condition. The profession is taking a breath before the wave hits.
The Work-Life Balance Reformation
Dentistry has always been one of the most suicide-prone professions, driven by isolation, perfectionism, and crushing financial pressure. The pandemic, for all its horror, gave many dentists permission to step off the treadmill. A 2022 ADA survey found that a significant percentage of dentist-owners had reduced their clinical hours permanently by one day per week.
This structural reduction in operating hours is a deliberate choice, not a market failure. A practice that was open five days a week in 2019 and is now open four days is 20% less active by the arithmetic of available chair time. But the dentist is not unemployed; the dentist is at their kid’s soccer game. The production per clinical hour is often unchanged or higher, but the total weekly production is mathematically capped by the reduced schedule. This is a lifestyle decision that masquerades as a productivity decline in aggregate national statistics. When the Bureau of Labor Statistics reports a slight drop in dental service output per establishment, they are partially measuring the collective decision of a burnt-out profession to reclaim Wednesday as a day of rest.
The Transition from Associate to Owner
A structural market shift is the declining number of solo private practices and the rise of the perpetual associate. An associate dentist is an employee, often paid on production. They have no equity and less incentive to hustle at a 30% collection rate. The owner-dentist historically worked 50-hour weeks because every dollar of profit flowed to them. The associate works 32 hours, produces what they produce, and goes home.
As the profession consolidates into DSOs and large group practices with associate-heavy models, the aggregate “activity per dentist FTE” is declining because the incentive structure has changed. The owner is motivated to extract maximum value from every operatory; the associate is motivated to survive the day without a patient complaint and collect a paycheck. This is not laziness; it is rational economic behavior. The practice is less active because the person holding the drill does not own the practice.
Important Note: The Measurement Problem
We gauge dental practice activity through production numbers, but these are inflated by fee schedule increases. If a practice produced $1 million in 2019 and $1 million in 2024, it is not “equally active.” After adjusting for 4-5% annual fee inflation, that 2024 million dollars represents roughly 15-20% fewer actual procedures performed. The nominal revenue flatline masks a real decline in clinical volume. Most “stable” practices have seen a real terms decrease in treatment output.
Conclusion
Dental practices are becoming less active in terms of raw patient volume and number of procedures performed, but this is driven primarily by a crippling hygienist shortage, the deliberate rejection of assembly-line dentistry by burned-out practitioners, and strategic insurance de-participation rather than a collapse in patient demand. The aging population of heavily-restored Baby Boomers guarantees a surge of complex care needs that will fill the schedules of practices that survive the current staffing crisis. The quieter waiting room reflects not the death of dentistry but its painful, overdue metamorphosis into a slower, more sustainable profession.
FAQ
Q: Why is it so hard to find a dental hygienist right now?
A: During the COVID-19 shutdowns, many hygienists retired early, switched to non-clinical roles, or left healthcare entirely. At the same time, hygiene school enrollments have not kept pace with the attrition. The labor pool shrank by approximately 8-10% while patient demand rebounded. This supply-demand mismatch allows hygienists to demand higher wages and choose temporary “temp” work over permanent positions, leaving many dental offices unable to fill hygiene columns. The shortage is structural and expected to persist for years.
Q: Is it a red flag if a dental practice has wide-open scheduling availability?
A: Not necessarily. It could indicate a practice newly transitioning to fee-for-service that lost PPO patients, a practice that deliberately extended appointment times for quality care, or a new associate building a patient base. However, if the practice has been established for years, participates in major PPO plans, and has immediate availability for a new patient cleaning, it could signal a declining reputation, high staff turnover, or poor patient retention. Ask directly: “I’m surprised you have openings so soon; is there a reason?” Their response will be telling.
Q: Will dental practices ever return to the “normal” activity of 2019?
A: In terms of patient encounter volume, unlikely. The profession has structurally shifted. The hygienist shortage is a multi-year pipeline problem, and dentists who have tasted a four-day work week with higher per-patient production are not eager to return to five days of rush. The 2019 hamster wheel was burning the profession out. The new equilibrium will likely feature fewer total patient visits but higher treatment acceptance per visit and higher fees per procedure. Dentistry is trading quantity for quality, and that transaction may be permanent.
Additional Resource
For current workforce data and practice activity trend reports, the ADA Health Policy Institute publishes annual surveys on dental practice capacity, staffing shortages, and economic outlook at www.ada.org/resources/research/health-policy-institute.